We manage nitrogen levels continually in-crop during the cotton season.
Black Earth participates in a system developed by Back Paddock Company and Nutrilab Agricultural laboratories to improve the performance and efficiencies of nitrogen in cotton systems. This entails leaf blade sampling early season to identify broad nutritional issues in cotton followed by three to four separate periods of cotton petioles sampling during flowering to capture a picture of nitrogen levels in time for actionable remediation.
This is possible due to processes developed that allow field sampling, fast delivery and processing by Nutrilab that results in the rapid turnaround of leaf/petiole nutrition results within 3 to 4 days of the sampling. The results from cotton petiole testing for nitrogen is regarded as a leading indicator, enabling management decisions to succeed before deficits are evident in the crop.
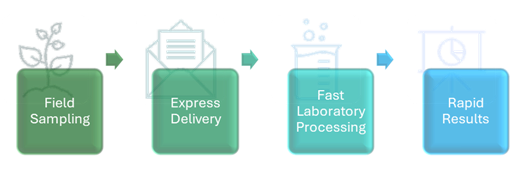
Figure 1 below is an example showing three separate sampling periods and the petiole nitrate levels at different day degrees after sowing. It shows that the nitrate levels remained within a satisfactory range between the red and orange lines during the season. If the black lined curve showed nitrate levels were likely to drop below the orange line before the maturity of the cotton crop, remedial action could be taken to lift nitrate levels for an acceptable finish.
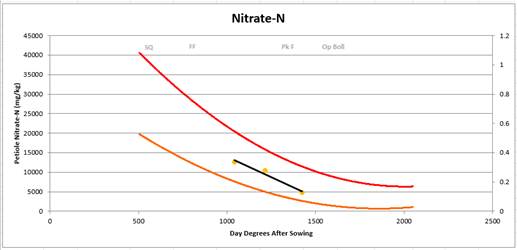
Figure 1: Petiole nitrate levels for three samples on different day degrees from sowing.
This system allows for less nitrogen inputs upfront and increases nitrogen fertiliser efficiency as the crop reveals what it needs as it develops through continuous tissue sampling.
Early season leaf blade sampling allows for management of other important nutrients well before the increased nutritional requirements during fruit development, flowering and boll fill. Leaf blade testing determines levels for:
- Boron
- Copper
- Magnesium
- Manganese
- Phosphorus
- Potassium
- Sodium
- Sulphur
- Zinc
Figure 2 below shows some of the results of the early leaf blade testing along with the minimum and maximum desirable level of each result.
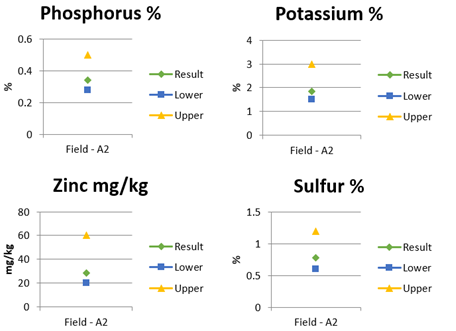
Figure 2: Leaf blade sample results for P, K, Zn and S.