The decision to plant can often be a difficult one. Determining whether to plant immediately on the moisture that is there now, delay until later in the season or leave the field to winter cropping is a significant decision. Many growers will use their hard-fought experience and intuition to select a course of action however an understanding of the risks and the corresponding returns are often hard to grasp.
Initial soil moisture plays a significant role in the planting decision risk. A greater soil moisture profile lowers risk and increases the chances of a good return by allowing for reduced reliance of rainfall. In this article I will explore the use of the APSIM modelling software to evaluate the risks associated with planting Sorghum at different soil moisture rates and the associated yield potential.
The APSIM model was developed to simulate many of the agricultural and plant processes that impact the growth and development of a crop. [i] This allows a user to simulate what would have happened in the development of a crop in any particular year given the weather assuming different levels of soil moisture. As with any model, it is important to understand what the model does and does not consider. The sorghum model in APSIM considers temperature, rainfall, radiation, soil water, frost impact on leaves and soil nitrogen. The model ignores other factors such as heat blast, pest damage, certain soil constraints and other such aspects. [ii]
Each crop was modelled under ideal circumstances with each year’s crop starting with plenty of nitrogen and no other limiting factors. Starting moisture was assumed to run evenly from the top of the soil profile ignoring the possibility of variable moisture in the top layers which is another aspect of planting risk not explored in this model. The years from 1957 (better quality data from that date) to 2020 were modelled but the charts for the previous 100 years look very similar. The cropping cycle in these charts is based on a 1st of October planting. The cultivar used in the modelling was Buster and the soils were assumed to be a heavy black clay.
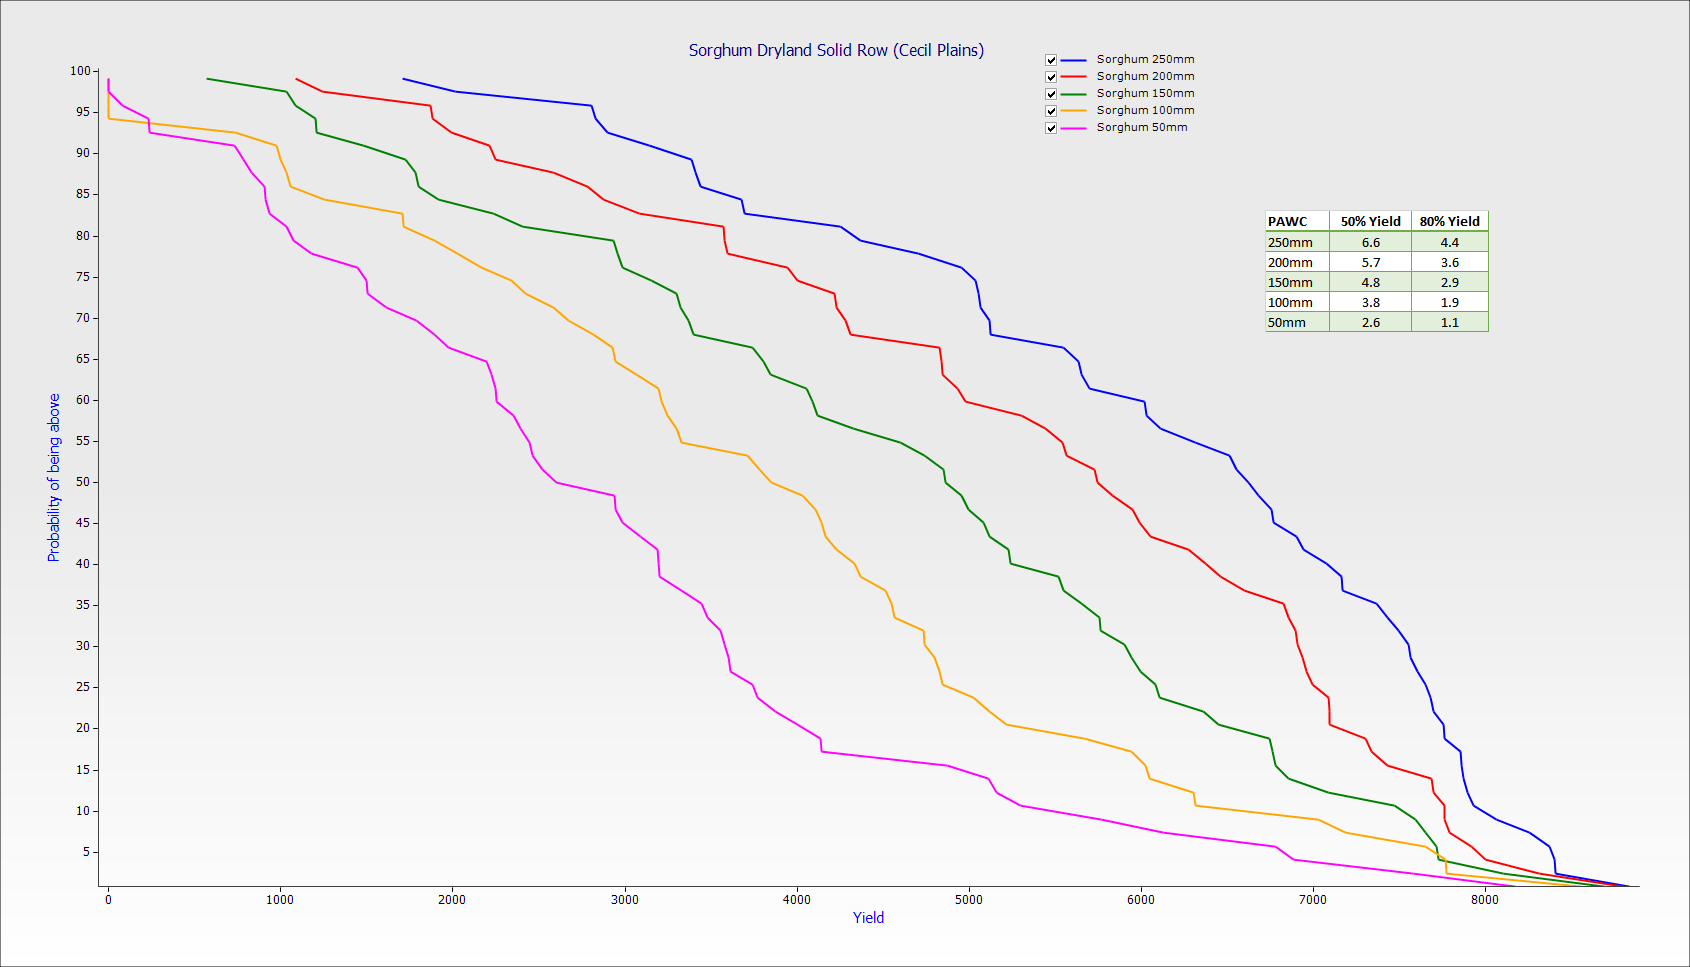
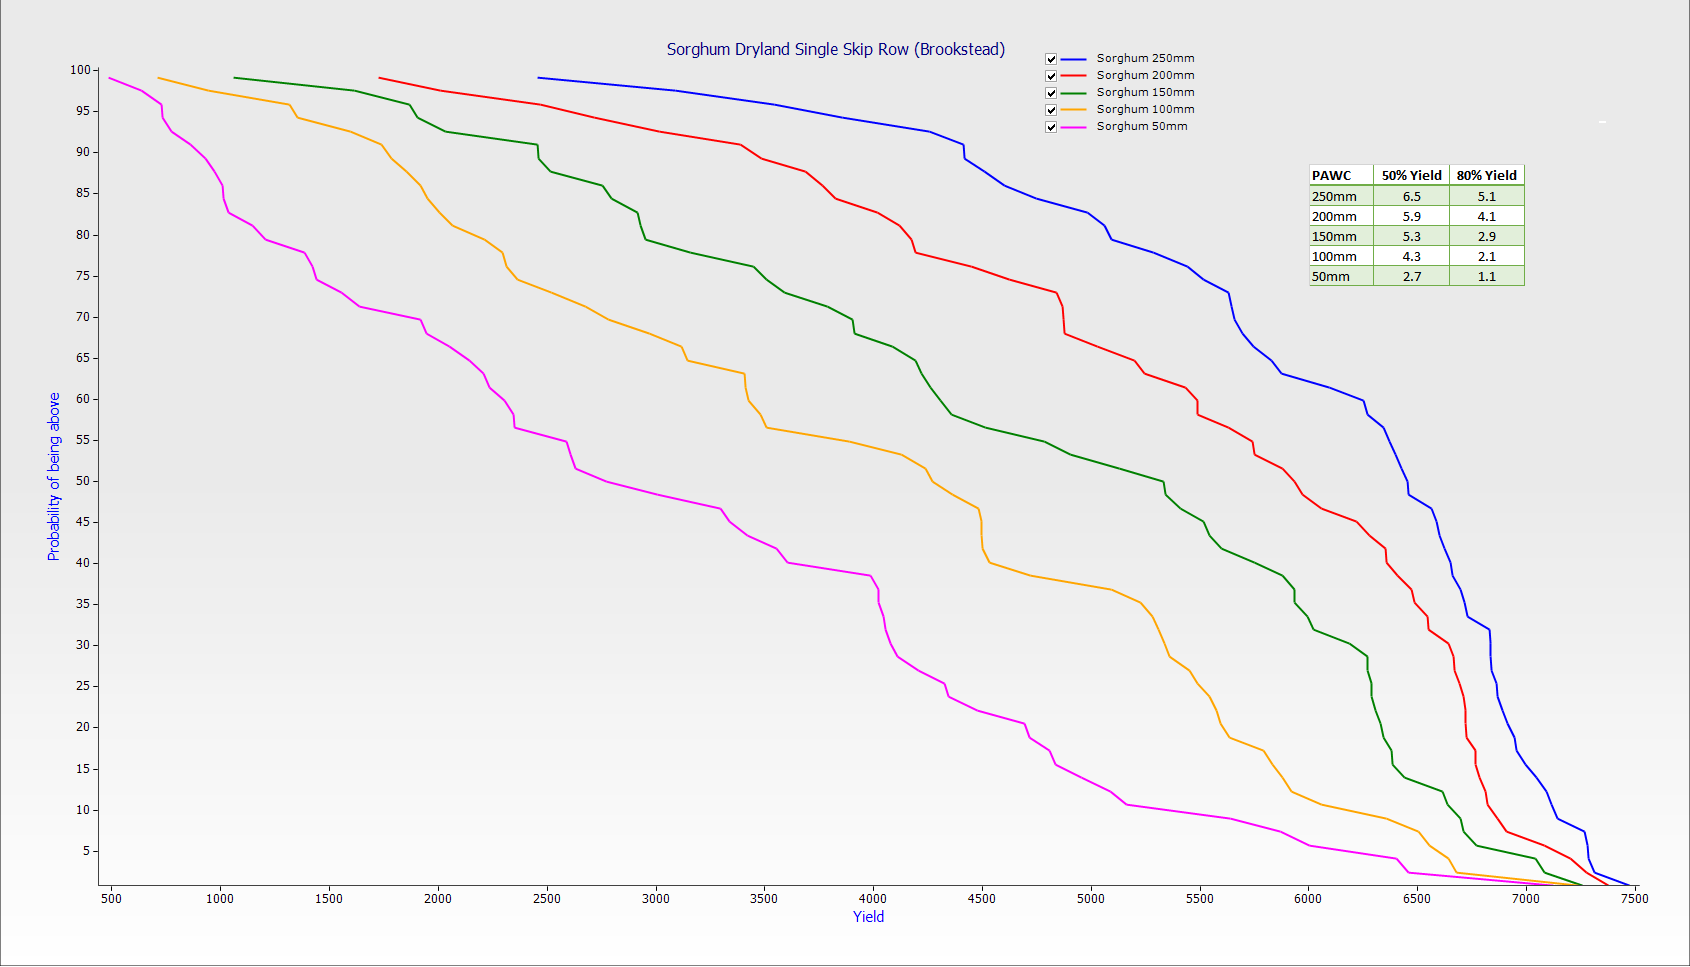
Once the software has modelled the crop for each year a probability exceedance chart can be created. This shows the projected yield for sorghum given each year’s daily weather data and the starting moisture. A 50% chance of exceedance suggests that in 50% of the previously modelled years, the crop would have exceeded the corresponding yield. The charts allow you to consider what level of risk you would be willing to take on for any target yield based on historical weather data and starting moisture.
In each of the charts, I have added a small table showing the 50% and 90% chance of exceedance for different starting moistures.


There are reasons to be cautious of concentrating too much on the specific numbers shown in the charts. It would be better to focus on the lower resolution (big picture) value of the charts rather than a high-resolution interpretation as this might be misleading.
The historic climate data is limited to 63 years of data and the local climate may have shifted over the last 20-30 years due to climate change. The model is a simulation that will neglect many aspects of everyday agronomy, management and operations.
While considering these caveats, the charts provide can help facilitate an understanding of the level of risk and yield expectation at varying starting moisture levels for each local area under consideration.
Additional articles and charts concerning other crops will be coming to the website over the next few months. Links will be provided in this article as they come online.
If there are any questions regarding the content of this article feel free to contact Robert Boulton at [email protected] or 0428 615 711.
The use of ASPIM for this article comes under the Non Commercial R&D License as laid out at What is commercial use?
[i] The ASPIM Initiative – About Us
