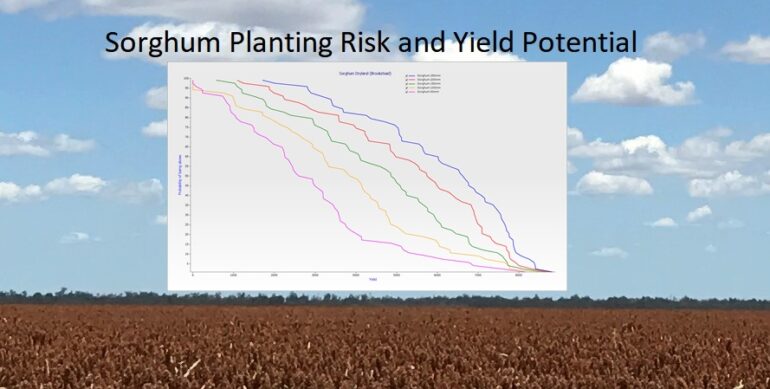
In this article I will explore the use of the APSIM modelling software to evaluate the risks associated with planting Sorghum at different soil moisture rates and the associated yield potential.
Sorghum Planting Risk and Yield Potential using APSIM

![]()

In this article I will explore the use of the APSIM modelling software to evaluate the risks associated with planting Sorghum at different soil moisture rates and the associated yield potential.
Over the past five years I have been exploring various potential applications of Normalized Difference Vegetation Index (NDVI) satellite imagery for use within a broad range of agronomic practices. Combined with infield monitoring, this imagery can be used to assess and identify causes of variation within a field, including varying soil types, soil constraints, plant available water capacity (PAWC), plant stand quality, poor drainage, plant health and disease. The usefulness tool is compounded by the availability of historic imagery of fields dating back as early as 2000.
The purpose of this article is to outline various considerations I explored as to how NDVI satellite imagery can be used for defoliation timing in cotton. I will discuss the practical application of using this technology, as well as benefits and limitations I have encountered since adopting this approach as part of my field management. Recently I have been using imagery software provided by Satamap Global, however other online imagery services, such as Data Farming, are equally as useful.
SVI/NDVI Application
Satamap Global provides imagery from Earth observation satellites such as Landsat 8 (including previous version data), MODIS, and Sentinel 2. It offers this imagery in the form of Satamap Vegetation Index (SVI) images, an index similar to NDVI which considers the different reflective properties of green, red and near infrared bands to give a picture of relative crop variation and development.
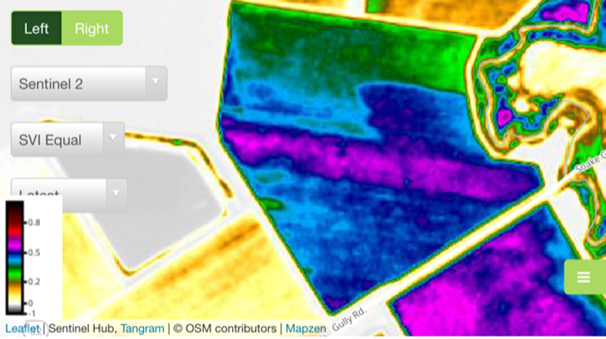
Image 1 shows a cotton field very close to its first defoliation. The pink area running through the middle of the field shows where an additional irrigation occurred, which correlated well with having the highest number of nodes above cracked boll (nacb) in the field. The colour scale shown in the bottom left corner reflects relative nacb across the field to some extent.
Image 1

Using SVI imagery, I identified some correlation between different fields and the colour scale/nacb on the same day but this did not always hold true. Occasionally there would be a discrepancy of up to 4 nacb when comparing colour scale/nacb across fields. Given this, I would be particularly cautious when using this between fields without physically inspecting both fields. The colour scale/ nacb correlation was particularly poor when comparing an irrigated field to a dryland field. Dryland fields were typically lower on the colour scale despite having higher nacb.
Another risk associated with using SVI to assess defoliation timing is that it is representative of vegetative growth, not crop quality or maturity. This means that regrowth in a field can show up higher in the colour scale. This is particularly true for refuge cotton due to its higher levels of vegetation, freshness of growth and regrowth. This year, weather conditions caused previously poor yielding areas of cotton to regrow at a higher rate than the better performing cotton, resulting in a higher figure on the colour scale than would otherwise be the case. Knowledge of the field and physical inspections were necessary to effectively manage this issue.
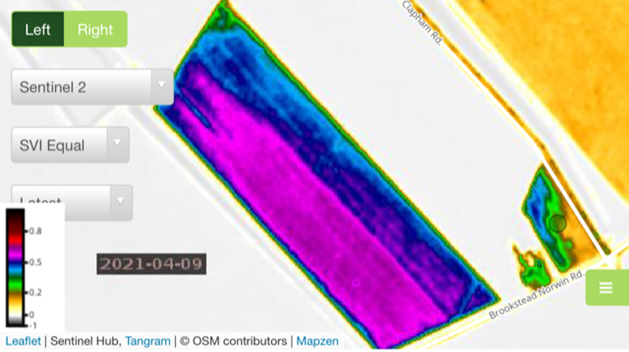
Image 2

Image 2 shows another cotton field close to defoliation. The pink area in this field represents a replanted portion of the field and was 2 to 4 nacb above the blue section. Physical inspection alongside the SVI imagery improved confidence in the decision to split the defoliation application timings, however, in this case there was enough of the field with similar maturity to delay until the entire field was ready for harvest. The pink flecked areas in the blue section were close to the same nacb as the late plant section.
Benefits to crop management
Over the past five years, the SVI imagery has proven to be a valuable tool for crop management for the following reasons:
Limitations of imagery
While the SVI imagery tool has enhanced crop management for Black Earth in recent years, it is not recommended that this technique be used in isolation. Regrowth and other factors often confused interpretation of images and some discrepancies between colour scale and nacb across fields were also noted. Given these limitations, field knowledge and physical inspections remain an important element of our company’s agronomic practice.
The information provided in this article is based on experience and knowledge developed over an extended period while operating as an Agronomist on the Darling Downs. The opinions contained within this post are entirely that and may not apply in all circumstances. We recommend consulting your own agronomist to ensure best performance on your own farm.
Progress Update: Using an EM38 for moisture measurement at Black Earth Agronomy
Over the last few years, we have been engaging in extensive trials using an electromagnetic device called an EM38 to measure moisture levels in the soils around Cecil Plains, Norwin and Brookstead. After working with Jenny Foley in collaboration with the DNRM as part of the CRDC funded project NRM1401, I believe we are finally reaching the point where our results are accurate and reliable enough to assist with decision making.
I’ll elaborate in another article as to how we have achieved this but in this article I will discuss the potential uses and applications for this technology.
In the Fallow
One application that I am sure everyone will be interested in is that of fallow moisture measurement. After soil calibration, Black Earth Agronomy should be able to walk into any section of a field and quickly ascertain plant available moisture levels for depths 0 - 75cm and 0 - 150cm. This means that it will no longer be necessary to run around a field with a push probe making rough guesses as to the underlying moisture.
Another application in fallow fields may be to use the EM38 along with APSIM modelling software (CSIRO) to determine potential yields for a range of crops under a variety of possible seasonal weather conditions. This would enable us to determine whether it was better to plant immediately or leave the field fallow until sufficient moisture has been accumulated in the soil profile to achieve a target yield. We could also use potential yield data along with gross profit margins to find the most valuable and viable cropping options for that part of ground at that particular time.
Irrigations Scheduling
The EM38 is going to be particularly useful for deciding when to irrigate. The EM38 can give us accurate information about a field's overall moisture deficit allowing us to anticipate and act upon deficits in a similar way to what we already do with the Neutron probe. Unlike the Neutron probe, the EM38 allows us to measure anywhere in the field because an access tube is not necessary. If a particular measurement location does not appear to be representative of the field, we can easily adjust that location.
Infield water use
Another potential use of the EM38 is to measure moisture levels before and then directly after irrigation to determine exactly how much water was actually applied to the field. This would not only allow you to determine your $/L but would also allow you to determine what water losses are occurring between the dam and the field.
Soil Variability Mapping
Soil variability and salinity mapping using the EM38 has been extensively used in other regions and could find some use in some circumstances on the Darling Downs. At this time we don’t have the software and equipment to accomplish this but this could change based on interest levels.
Other more speculative uses
There are a number of other potential uses that have not been fully tested at this stage.
One such use would be to determine the length of water logging events in different parts of the field and then using this information to limit water logging in future irrigation events.
Another potential use is to measure compaction within a field. This would allow us to measure the impact of different forms of traffic of the field so as to limit compaction in the future.
Conclusion
The soil calibrations for the EM38 should be up and running by the upcoming 2016-17 summer cropping season which means that many of these applications above will be available for use. If anyone would like a demonstration of the EM38 or would like to discuss possible uses on your farm please feel free to contact me on 0428 615 711 or at [email protected].
Written by Robert Boulton
The information provided above is based on experience and knowledge developed while operating as an Agronomist on the Darling Downs. The opinions contained within this post are entirely that, and may not apply to a grower's specific circumstance. We recommend consulting your own agronomist to ensure best performance on your own farm.

No comments by Robert Boulton yet.
