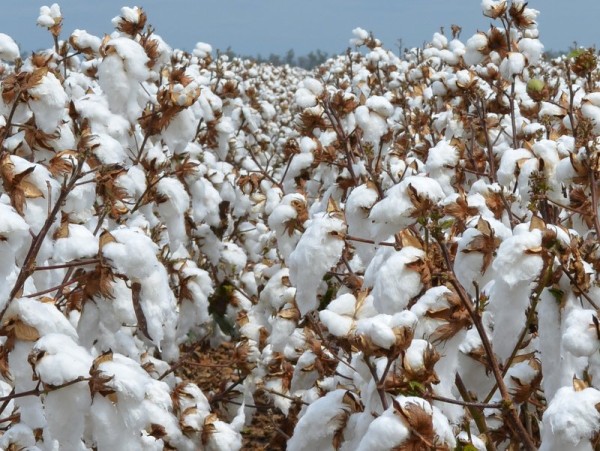
Over the past five years I have been exploring various potential applications of Normalized Difference Vegetation Index (NDVI) satellite imagery for use within a broad range of agronomic practices. Combined with infield monitoring, this imagery can be used to assess and identify causes of variation within a field, including varying soil types, soil constraints, plant available water capacity (PAWC), plant stand quality, poor drainage, plant health and disease. The usefulness tool is compounded by the availability of historic imagery of fields dating back as early as 2000.
The purpose of this article is to outline various considerations I explored as to how NDVI satellite imagery can be used for defoliation timing in cotton. I will discuss the practical application of using this technology, as well as benefits and limitations I have encountered since adopting this approach as part of my field management. Recently I have been using imagery software provided by Satamap Global, however other online imagery services, such as Data Farming, are equally as useful.
SVI/NDVI Application
Satamap Global provides imagery from Earth observation satellites such as Landsat 8 (including previous version data), MODIS, and Sentinel 2. It offers this imagery in the form of Satamap Vegetation Index (SVI) images, an index similar to NDVI which considers the different reflective properties of green, red and near infrared bands to give a picture of relative crop variation and development.
Image 1 shows a cotton field very close to its first defoliation. The pink area running through the middle of the field shows where an additional irrigation occurred, which correlated well with having the highest number of nodes above cracked boll (nacb) in the field. The colour scale shown in the bottom left corner reflects relative nacb across the field to some extent.
Image 1
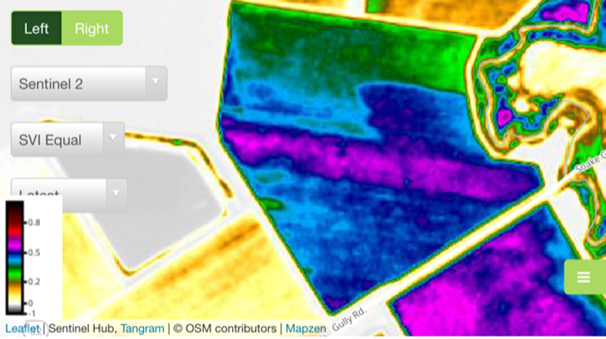
Using SVI imagery, I identified some correlation between different fields and the colour scale/nacb on the same day but this did not always hold true. Occasionally there would be a discrepancy of up to 4 nacb when comparing colour scale/nacb across fields. Given this, I would be particularly cautious when using this between fields without physically inspecting both fields. The colour scale/ nacb correlation was particularly poor when comparing an irrigated field to a dryland field. Dryland fields were typically lower on the colour scale despite having higher nacb.
Another risk associated with using SVI to assess defoliation timing is that it is representative of vegetative growth, not crop quality or maturity. This means that regrowth in a field can show up higher in the colour scale. This is particularly true for refuge cotton due to its higher levels of vegetation, freshness of growth and regrowth. This year, weather conditions caused previously poor yielding areas of cotton to regrow at a higher rate than the better performing cotton, resulting in a higher figure on the colour scale than would otherwise be the case. Knowledge of the field and physical inspections were necessary to effectively manage this issue.
Image 2
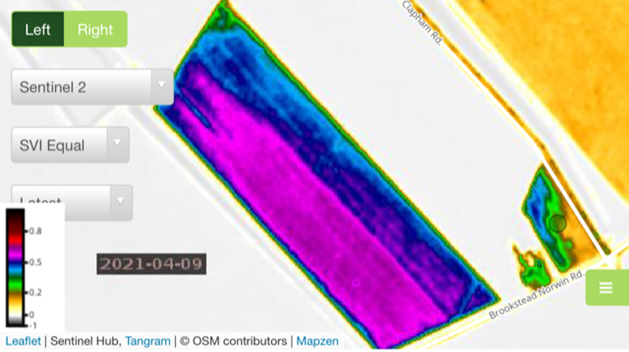
Image 2 shows another cotton field close to defoliation. The pink area in this field represents a replanted portion of the field and was 2 to 4 nacb above the blue section. Physical inspection alongside the SVI imagery improved confidence in the decision to split the defoliation application timings, however, in this case there was enough of the field with similar maturity to delay until the entire field was ready for harvest. The pink flecked areas in the blue section were close to the same nacb as the late plant section.
Benefits to crop management
Over the past five years, the SVI imagery has proven to be a valuable tool for crop management for the following reasons:
- It allowed me to more easily identify where to undertake physical inspections in fields and to determine optimal time for defoliation.
- It improved my understanding of the size of late maturing areas and how fields were developing as a whole
- It allowed for greater confidence in decision making and assisted in splitting sections for early defoliation.
Limitations of imagery
While the SVI imagery tool has enhanced crop management for Black Earth in recent years, it is not recommended that this technique be used in isolation. Regrowth and other factors often confused interpretation of images and some discrepancies between colour scale and nacb across fields were also noted. Given these limitations, field knowledge and physical inspections remain an important element of our company’s agronomic practice.
The information provided in this article is based on experience and knowledge developed over an extended period while operating as an Agronomist on the Darling Downs. The opinions contained within this post are entirely that and may not apply in all circumstances. We recommend consulting your own agronomist to ensure best performance on your own farm.